 Translate
Introduction
What is climate change?
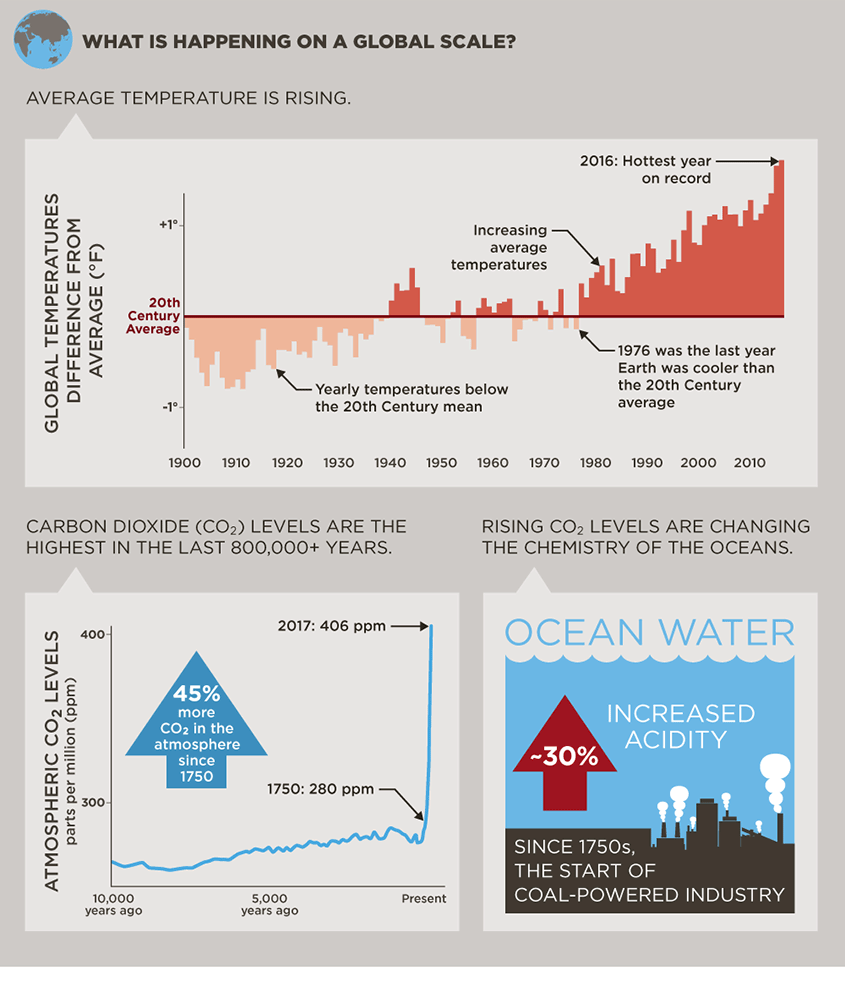
What is happening on a global scale?
Average temperature is rising.
Graph showing global temperature difference from 20th century average in degrees Fahrenheit. From 1900 through the late 1930s, temperature was below the mean. From then until 1976, temperature was both above and below the mean. After 1996, temperature has been above the mean and rising steadily. 2016 was the hottest year on record.
Carbon dioxide levels are the highest in the last 800,000+ years.
Atmospheric CO2 levels increased slightly since 10,000 years ago until pre-industrial times, then spiked from 208 parts per million to 406 parts per million between 1750 and 2017.
Rising CO2 levels are changing the chemistry of the oceans
Since the start of coal-powered industry in the 1750s, the acidity of ocean water has increased about 30%
Greenhouse gases in King County
Climate action, both to reduce GHG emissions and prepare for the impacts of climate change, is a long-standing and central priority for King County.
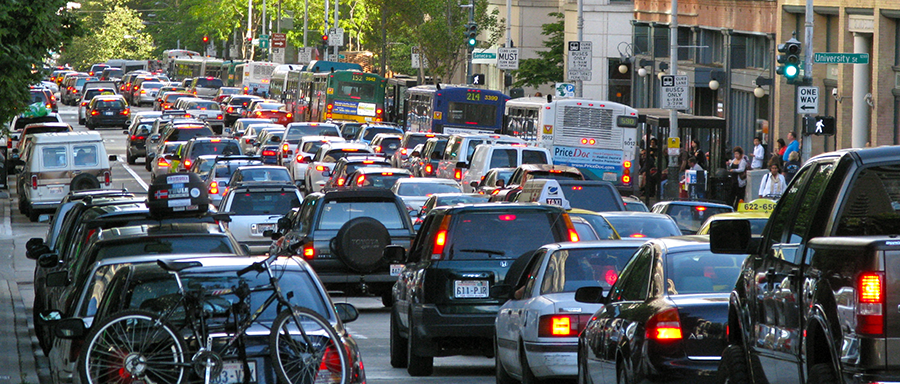
In 2015, the top sources of greenhouse gas (GHG) emissions in King County are from (1) fossil fuels used for transportation, and (2) energy used to heat, cool, and power homes and buildings. An additional significant source of GHG emissions is local consumption of goods and services, including the energy needed to produce, transport, use, and dispose of goods and services supporting county residents and businesses.
The pie chart below provides a breakdown of county-wide GHG emissions created by all residents, businesses, and government spending and consumption in 2015.
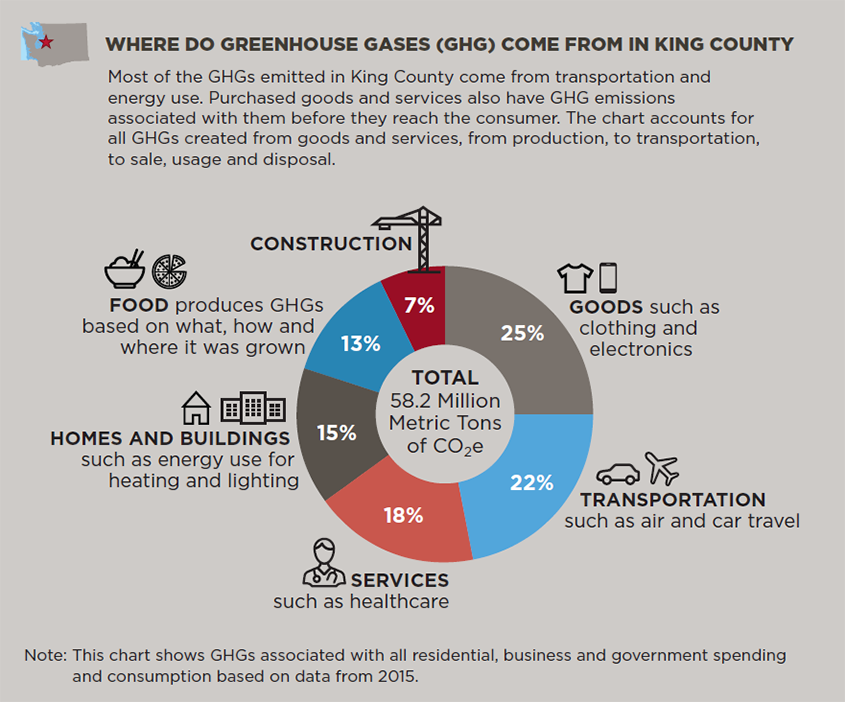
Where do greenhouse gases (GHG) come from in King County?
Most of the GHGs emitted in King County come from transportation and energy use. Purchased goods and services also have GHG emissions associated with them before they reach the consumer. The chart accounts for all GHGs created from goods and services, from production, to transportation, to sale, usage and disposal.
- 25% - Goods such as clothing and electronics.
- 22% - Transportation such as air and car travel.
- 18% - Services such as health care.
- 15% - Homes and buildings such as energy use for heating and lighting.
- 13% - Food produces GHGs based on what, how and where it was grown.
- 7% - Construction
Note: this chart shows GHGs associated with all residential, business and government spending and consumption based on data from 2015.