
 Translate
Opportunity Area Data Report
Report date:
This report provides additional data to support the case that a proposed acquisition project may qualify as an
Opportunity Area by serving communities that lack access to open space and experience demonstrated hardships.
Use the Opportunity
Areas map to find a property.
Please visit the Conservation Futures match waiver webpage for an explanation of Opportunity Areas. Additional links to potentially relevant data sources may be found in the Additional Data Sources for Opportunity Area Projects. For more information about using this data with particular grant programs, please visit the Conservation Futures match waiver or Healthy Communities and Parks Fund webpages.
Enter a 10-digit parcel number (PIN) below, or use the Opportunity Areas map to find a property.
Property information
Parcel number |
|
|---|---|
| Address | --- |
| Jurisdiction | --- |
| ZIP Code | --- |
| Parcel area | --- |
| Zoning | --- |
| Present Use | --- |
| Total appraised value | --- |
| Census tract | --- |
| Census block group | --- |
| Elementary School | --- |
Does property meet all 3 specified criteria?
| Criterion | Is criterion met? | Criterion value | What does this value mean? |
|---|---|---|---|
| Lowest 1/3 of median household incomes | --- | --- | The household incomes in this area are higher than --- percent of other areas of the county. Lower percentile values may indicate a stronger case for being in an opportunity area. |
| Highest 1/3 of hospitalization rates | --- | --- | Hospitalization rates in this area are higher than --- percent of other areas of the county. Higher percentile values may indicate a stronger case for being in an opportunity area. |
| Lacks access to open space | --- | --- | If there are no parks within 0.25 miles in the urban area, or within 2 miles in the rural area, may indicate a stronger case for being in an opportunity area. |
Additional Parcel Data
| Data Points | Percentile | What does this value mean? |
|---|---|---|
| For these first 8 data points, higher percentile values may indicate a stronger case for being in an opportunity area. | ||
| Poverty | --- | The percentage of impoverished households (at or below 200% of the federal poverty level) in this area is higher than XX percent of the county. |
| Free & reduced-price school meals | --- | The rate of individuals using free & reduced-price school meals in this area is higher than XX percent of the county. |
| Limited English-speaking households | --- | The percentage of limited English-speaking households in this area is higher than XX percent of the county. |
| Population under age 5 | --- | The percentage of people younger than 5 in this area is higher than XX percent of the county. |
| Population that are people of color | --- | The percentage of population that are people of color in this area is higher than XX percent of the county. |
| Population with disabilities | --- | The percentage of population with disabilities in this area is higher than XX percent of the county. |
| Population with disabilities and lacking health insurance | --- | The percentage of population with disabilities and without health insurance in this area is higher than XX percent of the county. |
| Households receiving food stamps / SNAP with 1+ person with disabilities | --- | The percentage of households receiving food stamps / SNAP with 1+ person with disabilities in this area is higher than XX percent of the county. |
| For these final 3 data points, lower percentile values may indicate a stronger case for being in an opportunity area. | ||
| Average life expectancy | --- | The average life expectancy in this area is higher than XX percent of the county, meaning that XX percent of the county has a higher average life expectancy than this area. |
| Open space & park density per capita (acres per person) | --- | The open space and park density in this area is higher than XX percent of the county, meaning that XX percent of the county has higher open space and park density than this area. |
| Tree canopy (neighborhood "greenness") | --- | The tree canopy in this area is higher than XX percent of the county, meaning that XX percent of the county has a higher degree of tree canopy than this area. |
How to interpret percentile
Percentiles tell you how your location ranks for that characteristic in relation to all other locations in King County, if they were ranked from 0 to 100.
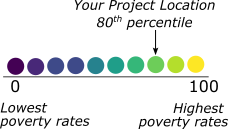
- 0 – 33rd percentiles indicate lower level of the characteristic/trait
- 34 – 66th percentiles indicate middle level of the characteristic/trait
- 67 – 100th percentiles indicate higher level of the characteristic/trait